Most research data are conveyed visually through graphs, tables, or images. However, in recent years, converting visual data into auditory data has emerged as a unique adjunctive means to convey information. This process is called sonification and can increase access to information to those with visual impairments. The most visible use of this process has been in the astrological field.
Catchy headlines, such as “What does a blackhole sound like?”, have popped up on social media sites. However, the emerging field of sonification is expanding, and researchers from many fields are contributing to a newly developed archive. The archive is an eclectic mix of disciplines with one thing in common, contributors are translating their findings into soundscapes.
Reference
Data Sonification Archive. https://sonification.design (accessed December 2, 2022).
Related Posts
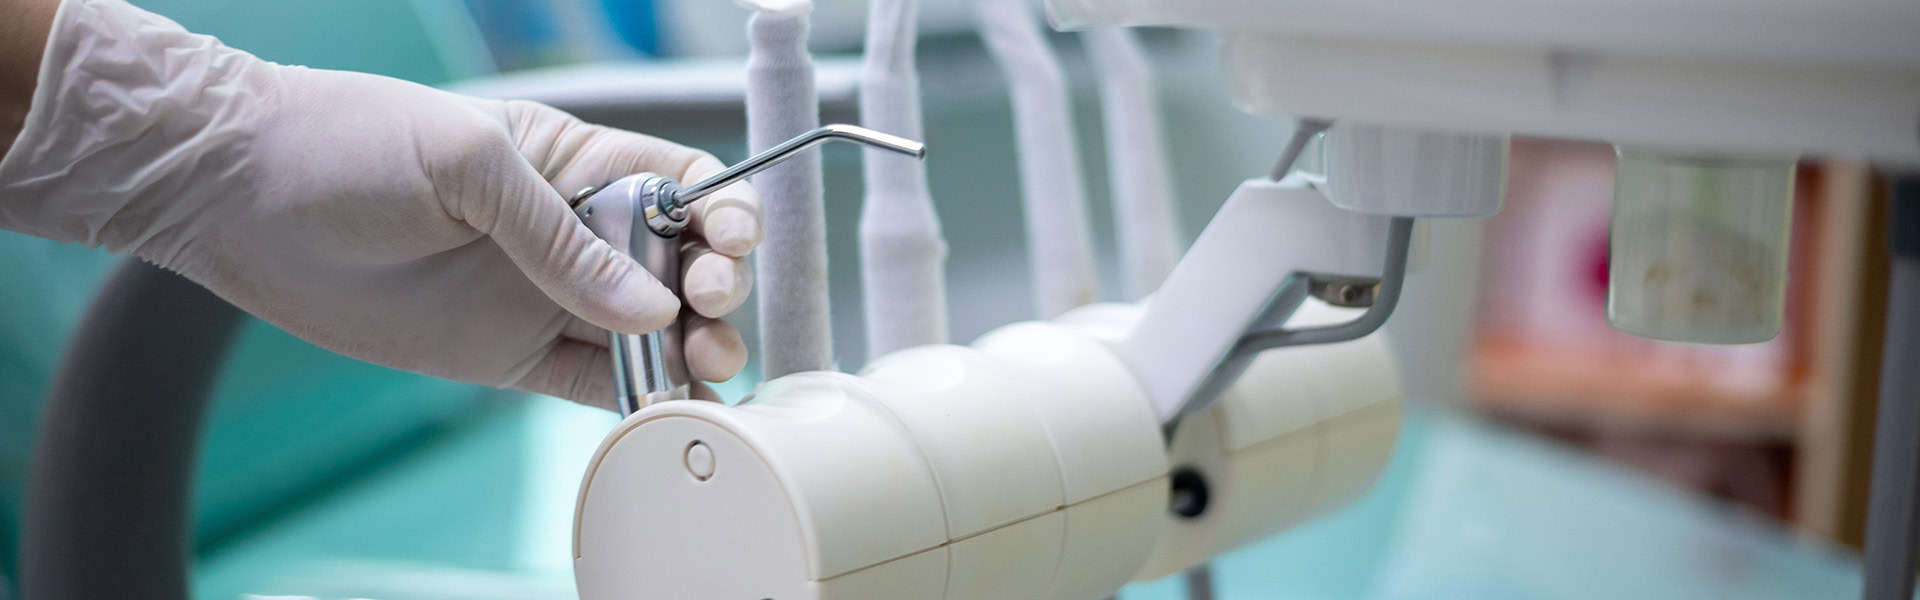
Echoes of Risk: Noise-Induced Hearing Loss in Dentistry
For audiologists, it is no surprise that dental professionals remain at risk of developing noise-induced hearing loss (NIHL). This risk is due to prolonged and…
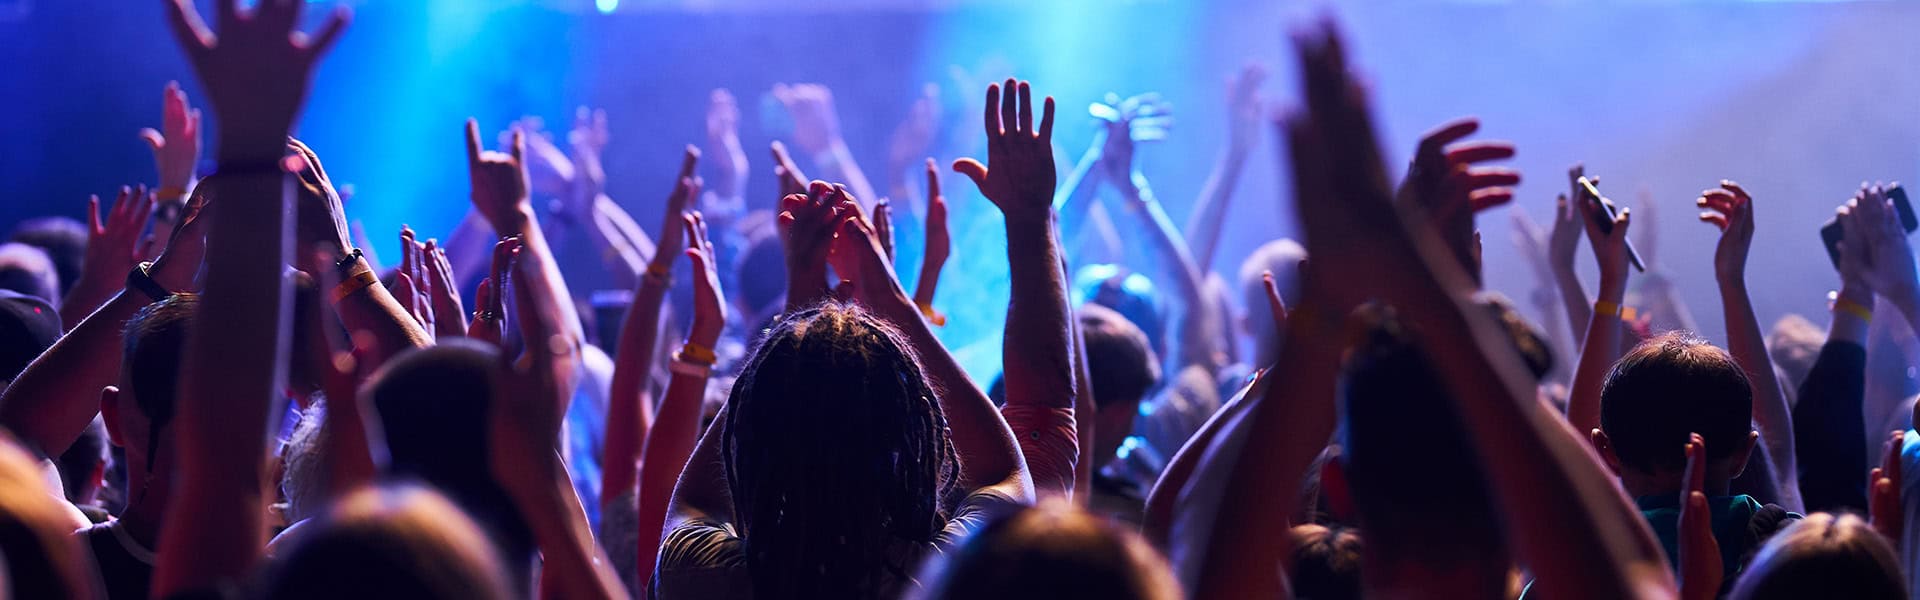
The Hobbies Most Likely to Cause Hearing Loss
Hobbies are important. They contribute to our overall health and well-being by helping us relax and escape everyday stressors. Audiologists know that some hobbies may…
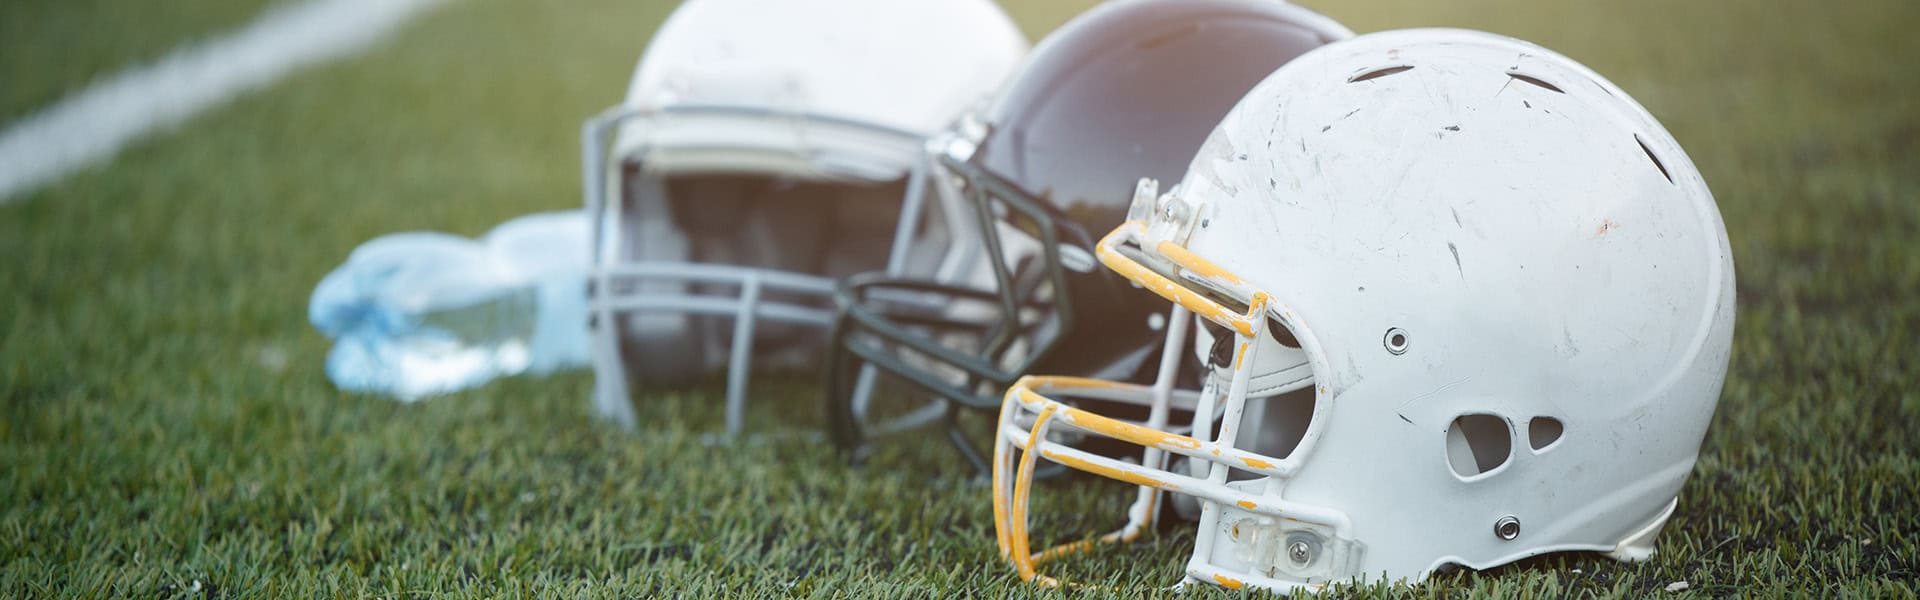
NCAA Approves Gallaudet’s Use of a Helmet for Deaf or Hard of Hearing Players This Season
A helmet designed by Gallaudet University and AT&T has been approved for use by the NCAA. Approval for the helmet in Division III college football…